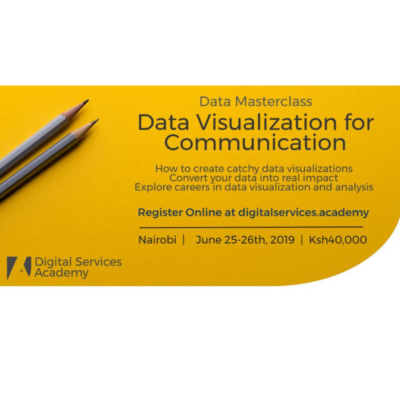
Training: Data Visualization for Communication

- This event has passed.
Training: Data Visualization for Communication
June 10, 2019 @ 8:00 am - 5:00 pm

Learn how to captivate your audiences with effective, interesting and purposeful data visualizations and infographics for the impact that you seek.
This short two-day course is a deep dive into adopting data visualization as a powerful tool to communicate ideas and stories. You will learn how to analyze data visually and find patterns, trends and outliers. At the end of the course, you will be able to use free tools and techniques to create eye-catching and engaging infographics.
For more information about this course, visit: http://digitalservices.academy/index.php/data-visualization-for-communication/
